Tired of having to create debug logs manually through trace flags?
If, like me, you’re tired of having to go into Setup and set trace flags on yourself or relevant users before beginning to test your new components JUST to have to navigate BACK to Debug Logs to see if they’re being created AND THEN having to open a full log to read …
Debug faster in Salesforce …
Open Developer Console by clicking the gear icon in the top right and clicking developer console (push both mouse buttons to open in new tab).
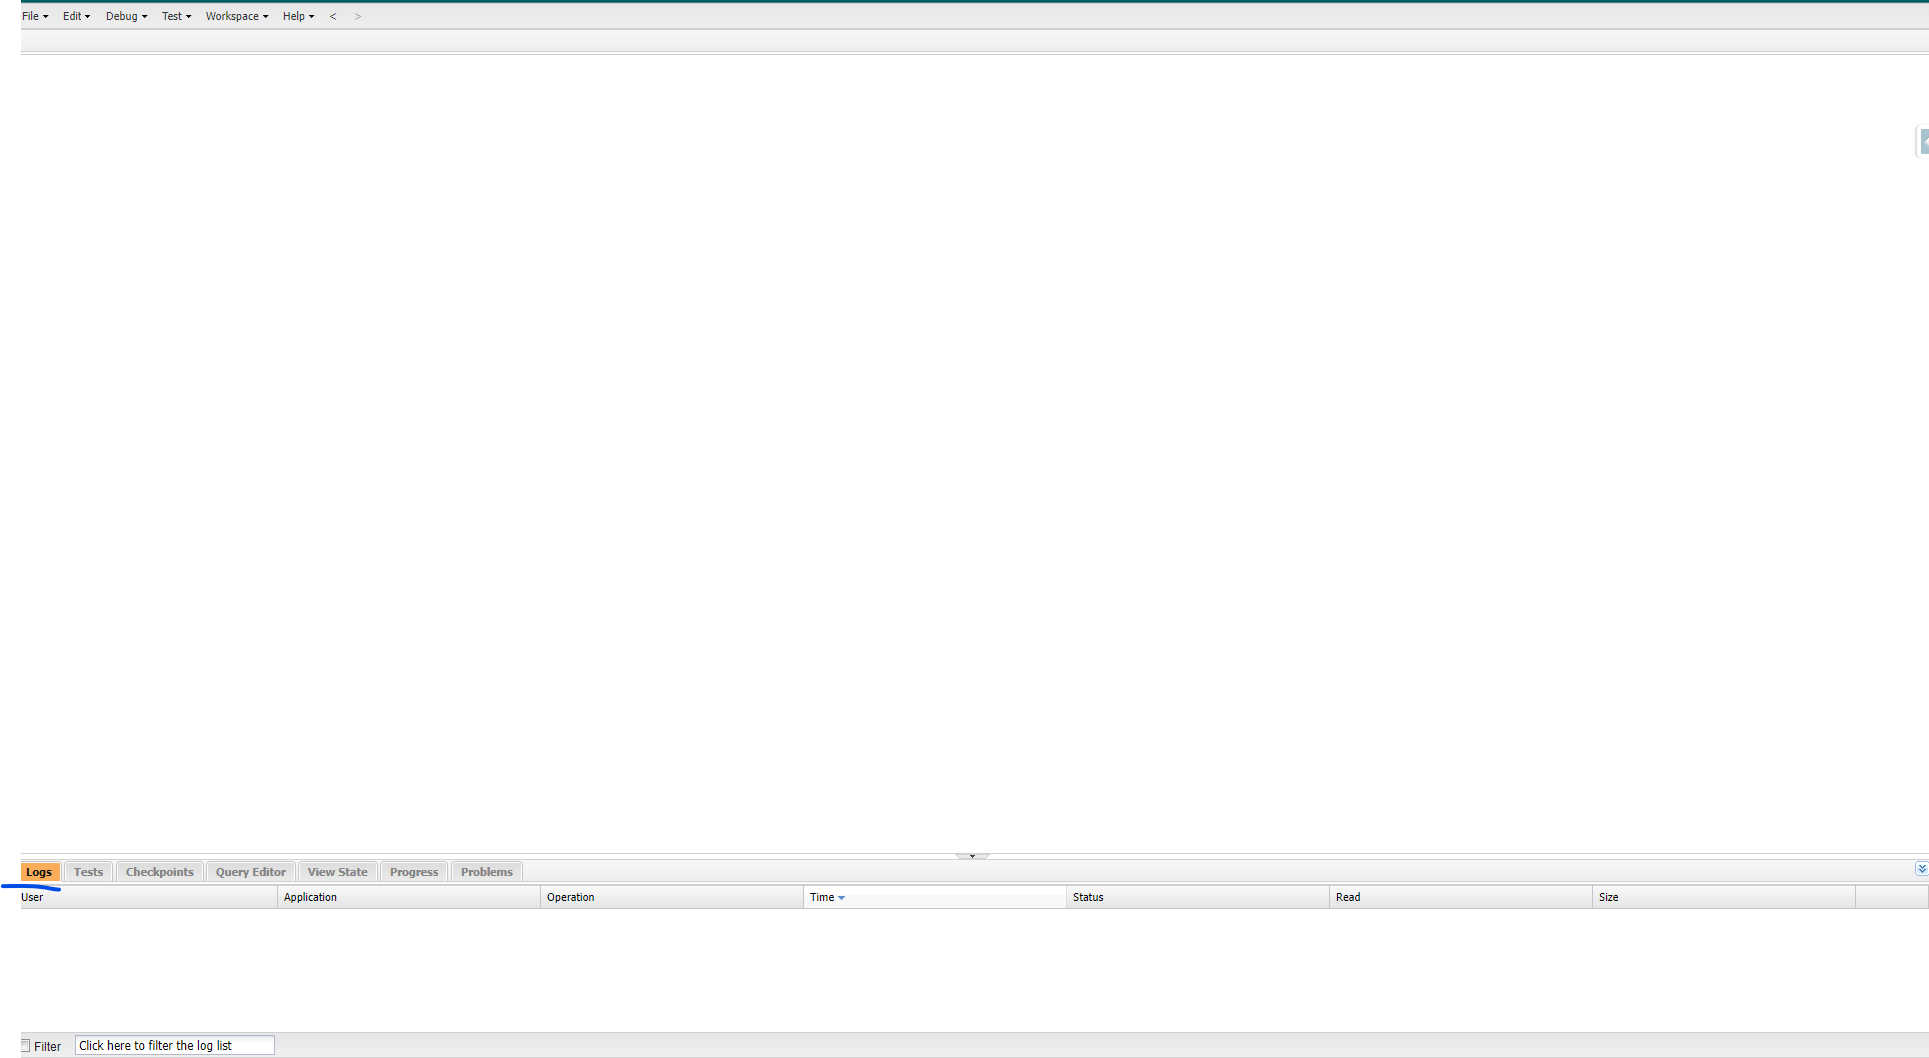
Once developer console is open … click on ‘Logs’ tab.
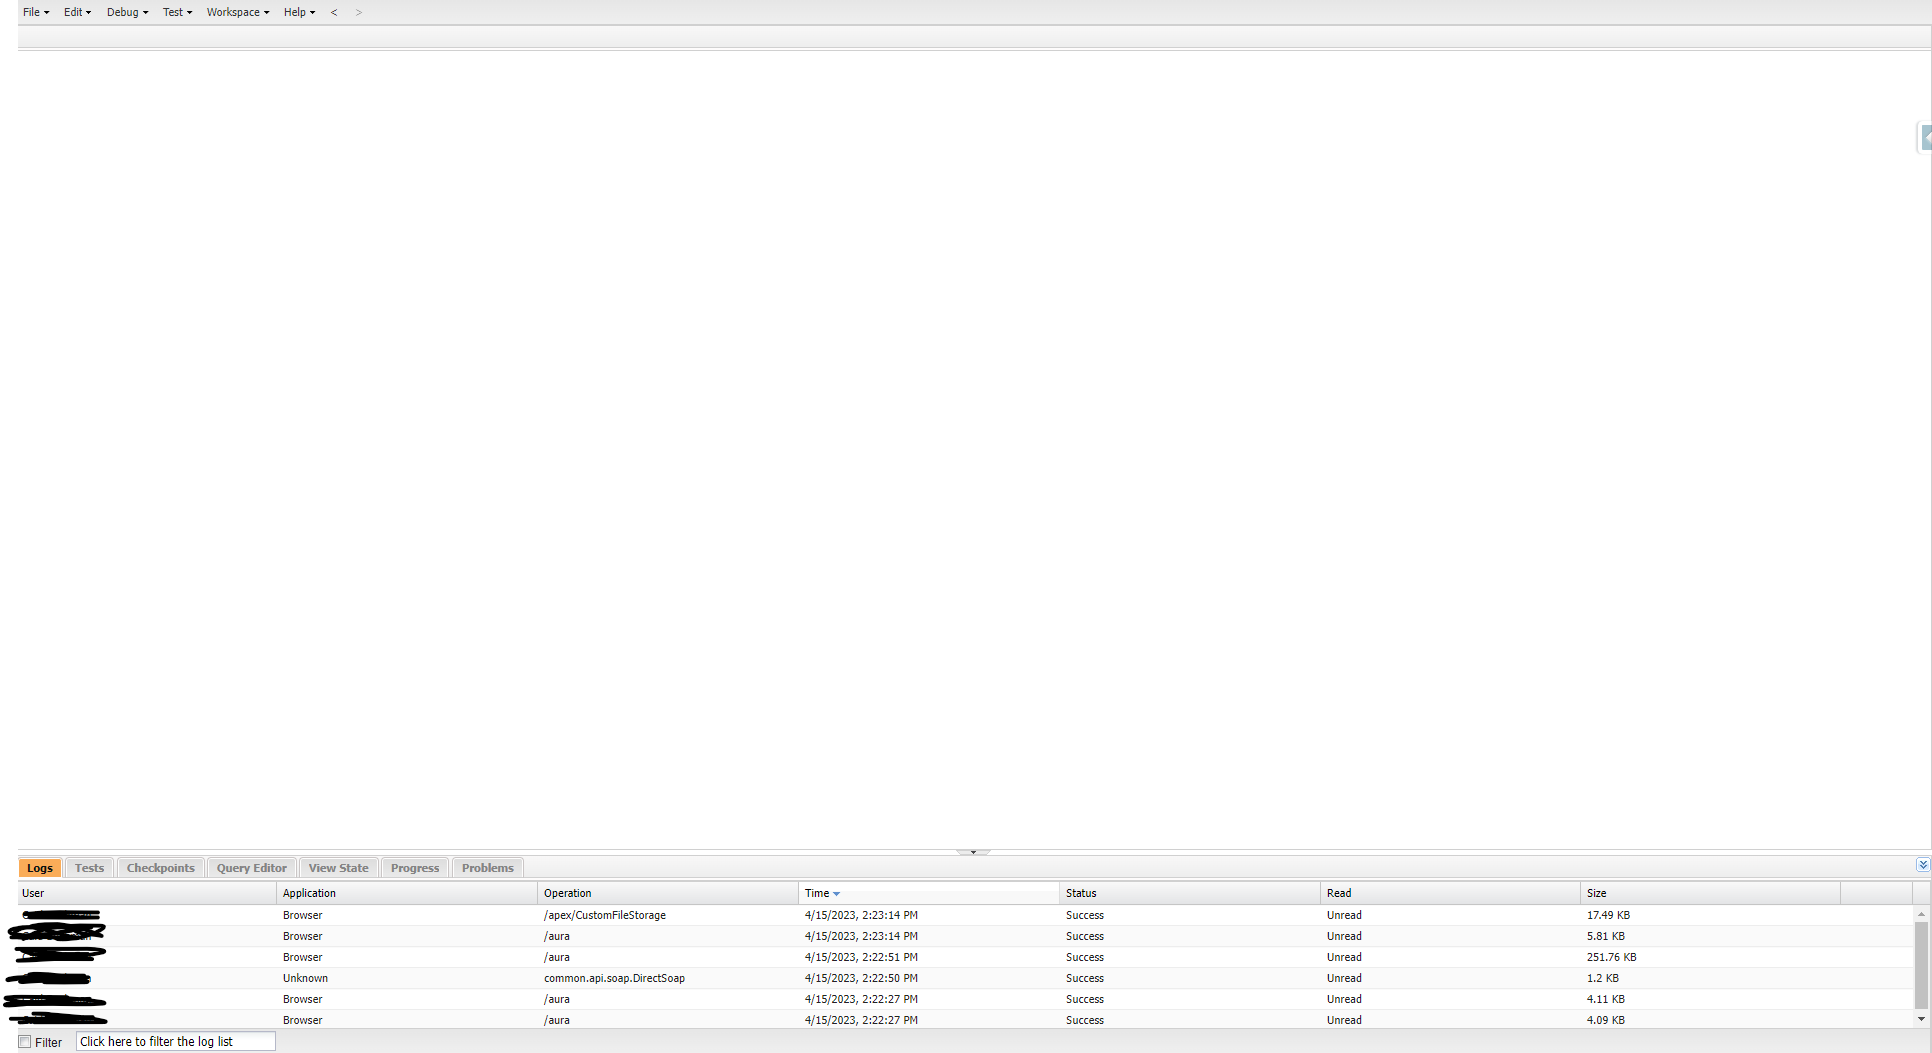
Make note of the most recent log listed (unless recent logs is empty) and go to one of your other salesforce-lightning tabs and begin testing your desired components/screens.
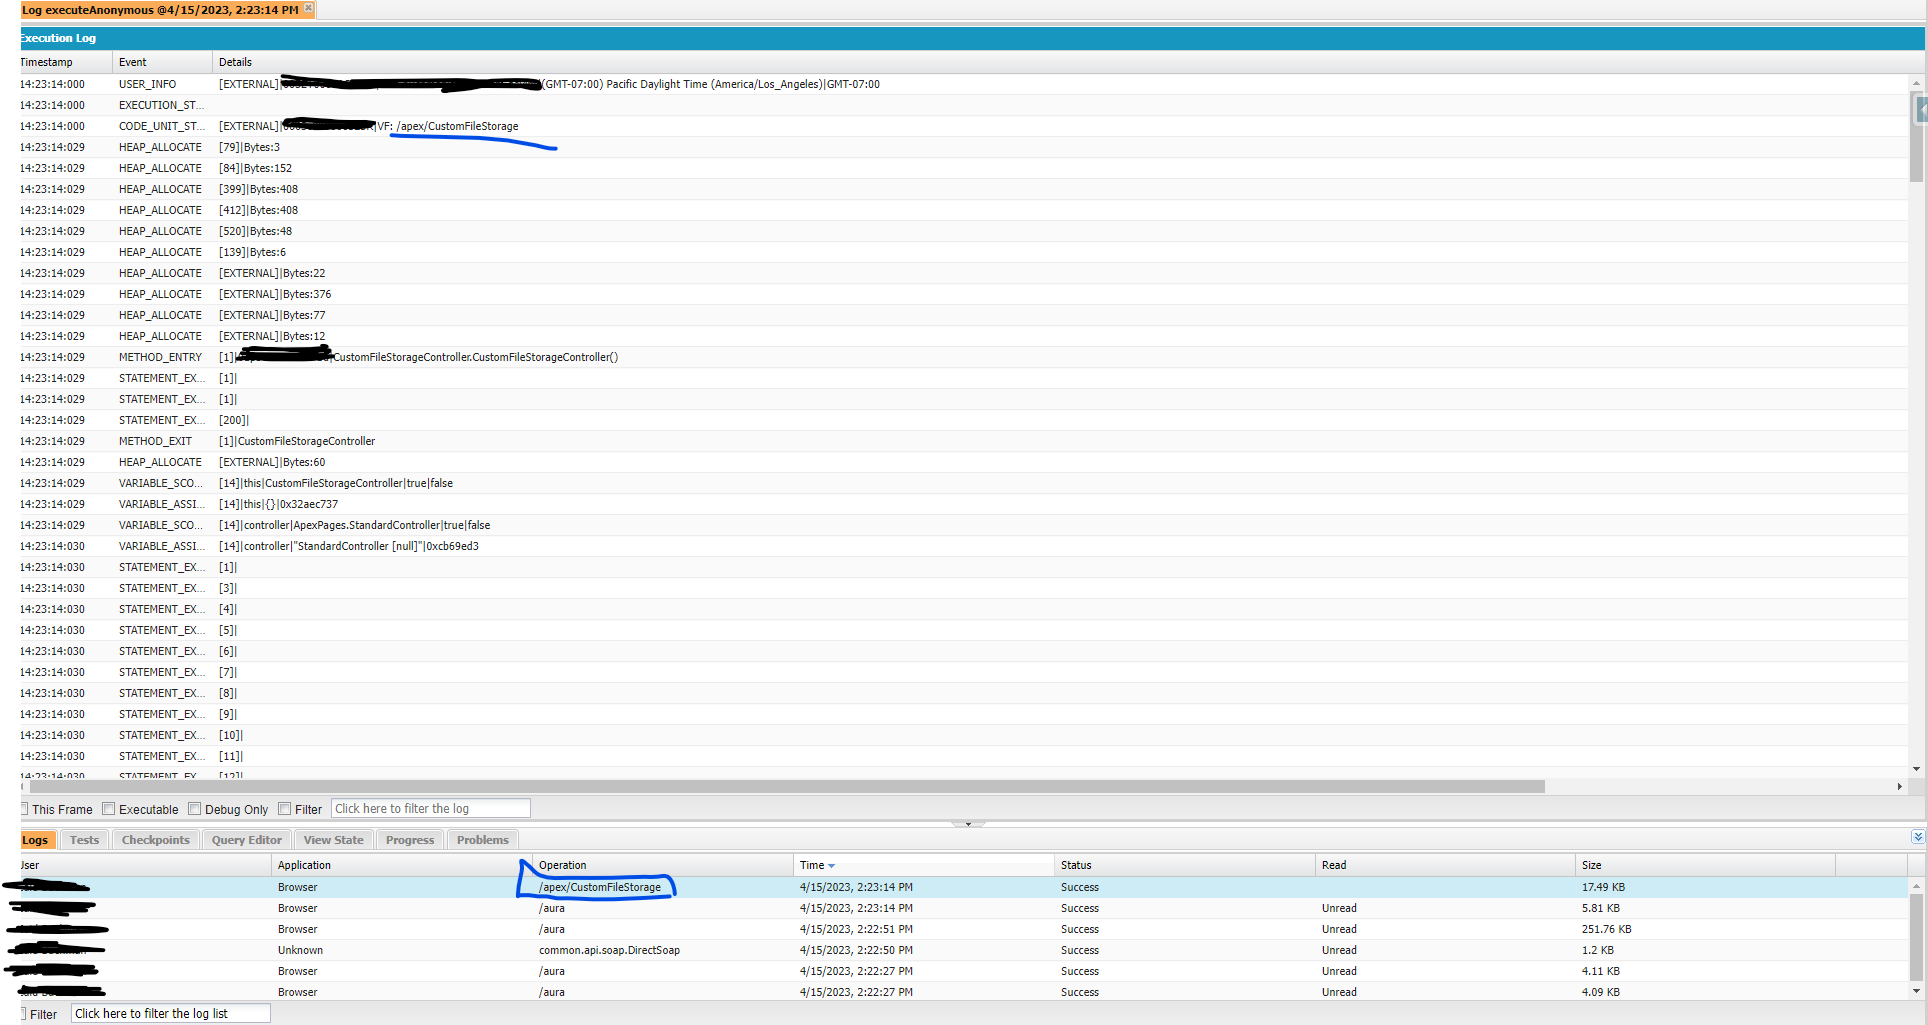
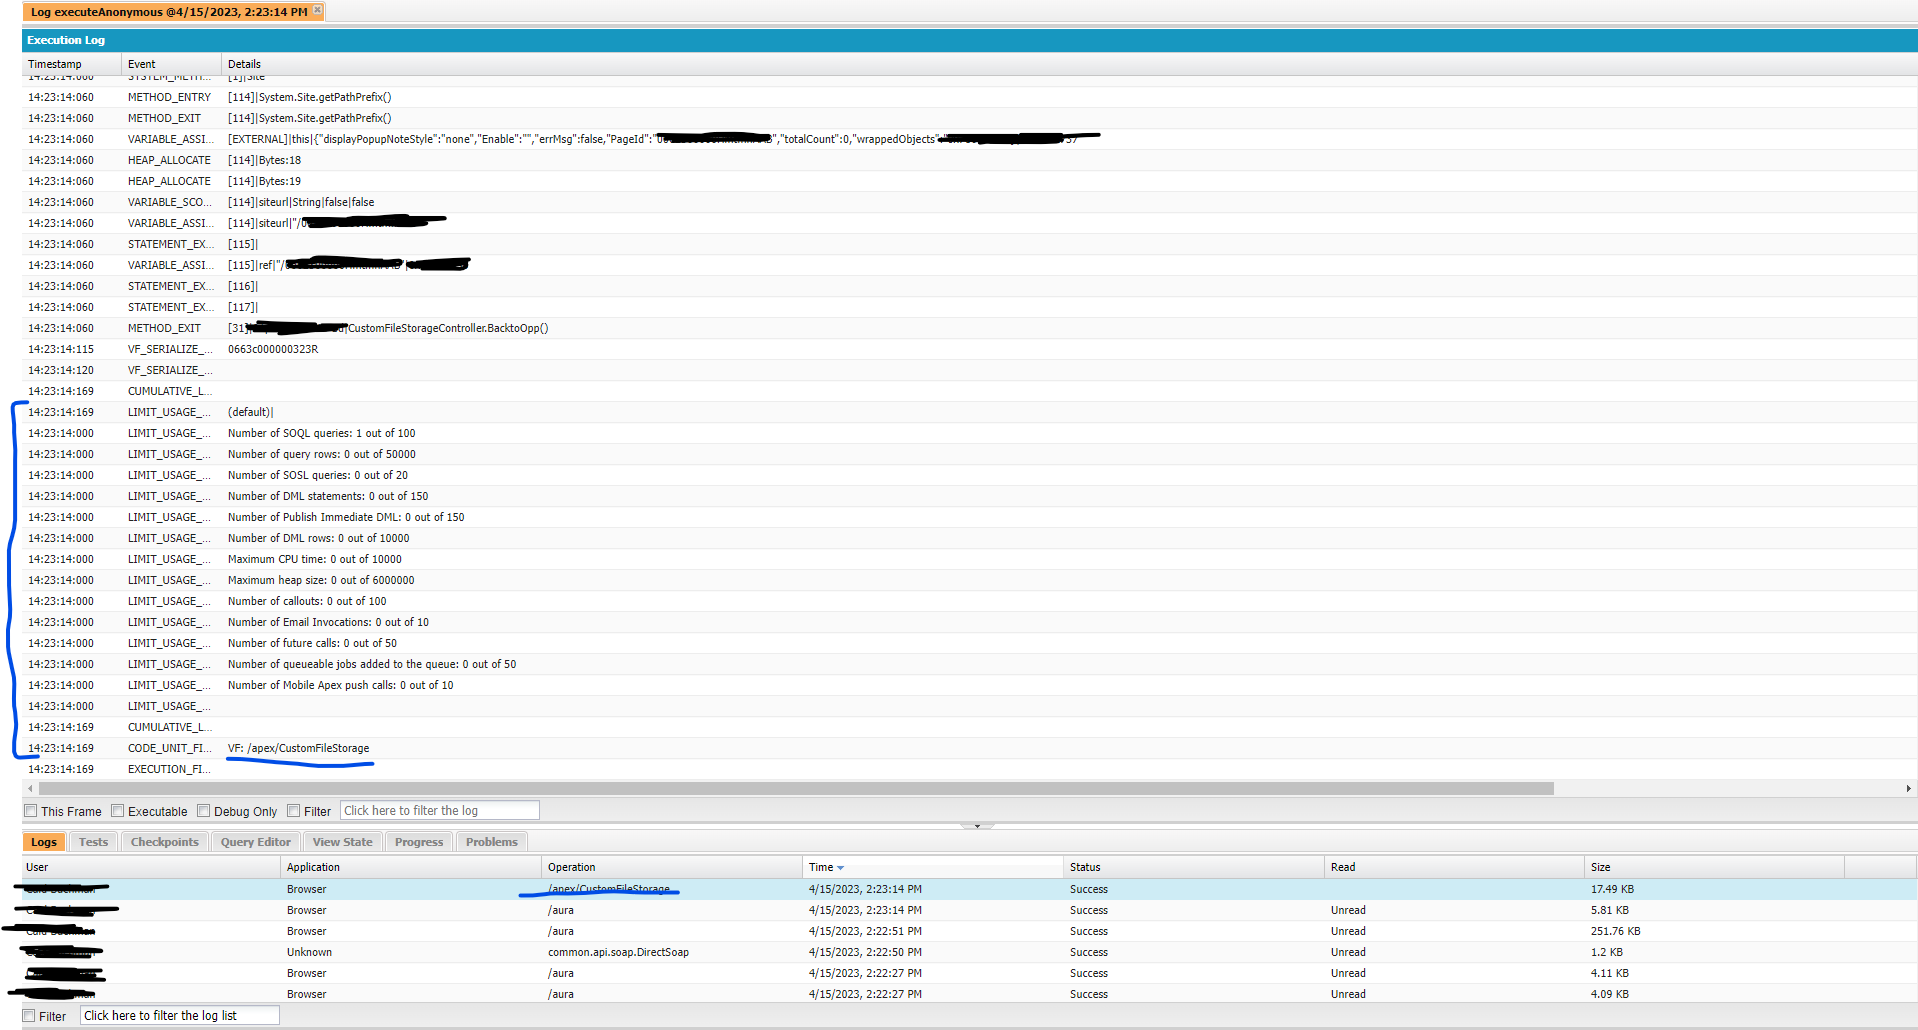
After finishing manual testing of the desired components … navigate back to your developer console tab and open one of the new logs listed (see apex example below)
Apex debug log start (notice how you can see when you are entering / exiting methods)
Apex debug log end (take note how you can see # of SOQL queries, DML statements, etc… all in one place)
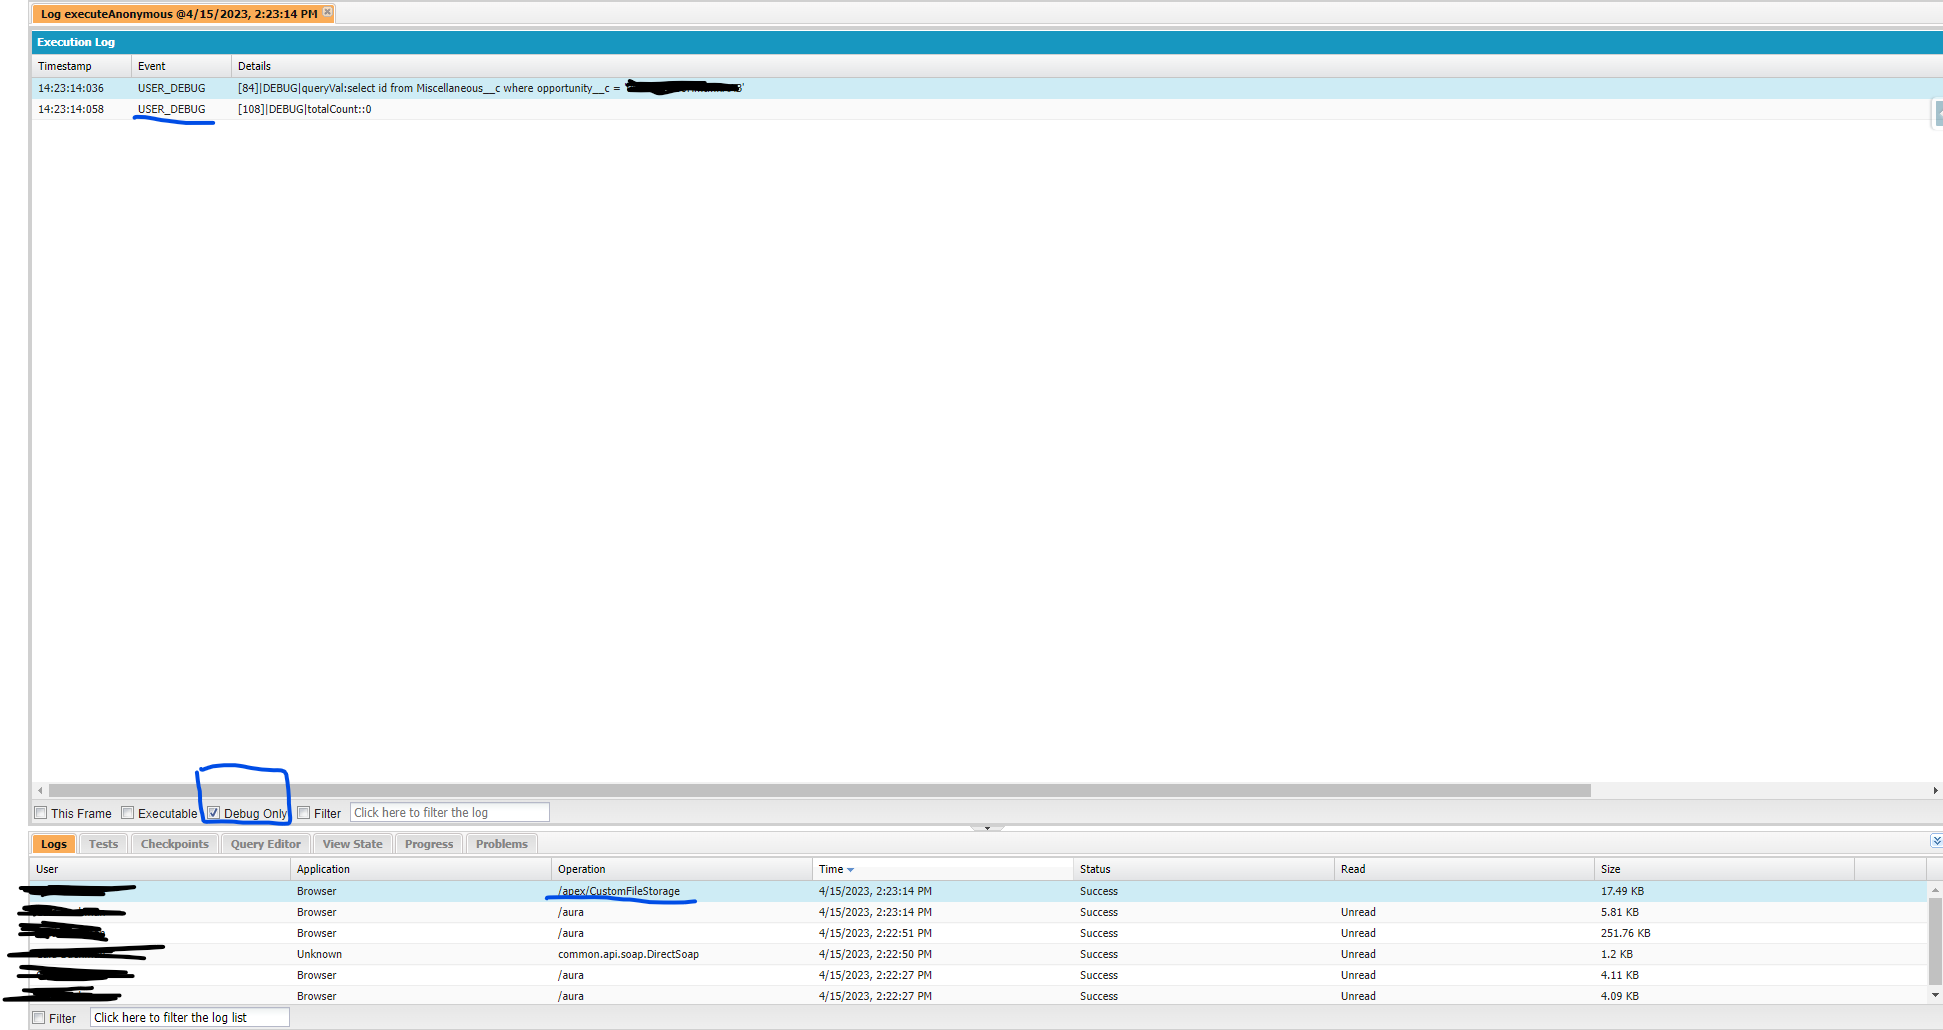
Filter for only your system debug statements in Apex by clicking ‘Debug Only’ for the fastest debugging experience.
Quick debugging tips
- open developer console in a new tab (push both mouse buttons on it for example)
- this quicker debugging outlined in the article only pertains to you the developer as the ‘running user’ ala likely System Administrator permissions
- once you start reading through longer debug logs you’ll beging to notice the order of execution (transaction horseshoe) Salesforce transactions take place in && it becomes very useful in studying for Platform Developer 1 && 2 exams.
- If something works for you as the developer in manual testing BUT then fails for another user … it’s a sharing or field permission issue 98% of the time.
- … As a follow up to the last bullet point … start your manual testing as a System Administrator (while leveraging the faster access to debug logs in Developer Console) -> then log-in as your desired user with particular profile of interest … IF fails -> check permissions … IF permissions are fine -> THEN finally start setting up ‘trace’ flags for the desired User and try to test again to create more specific logs

